

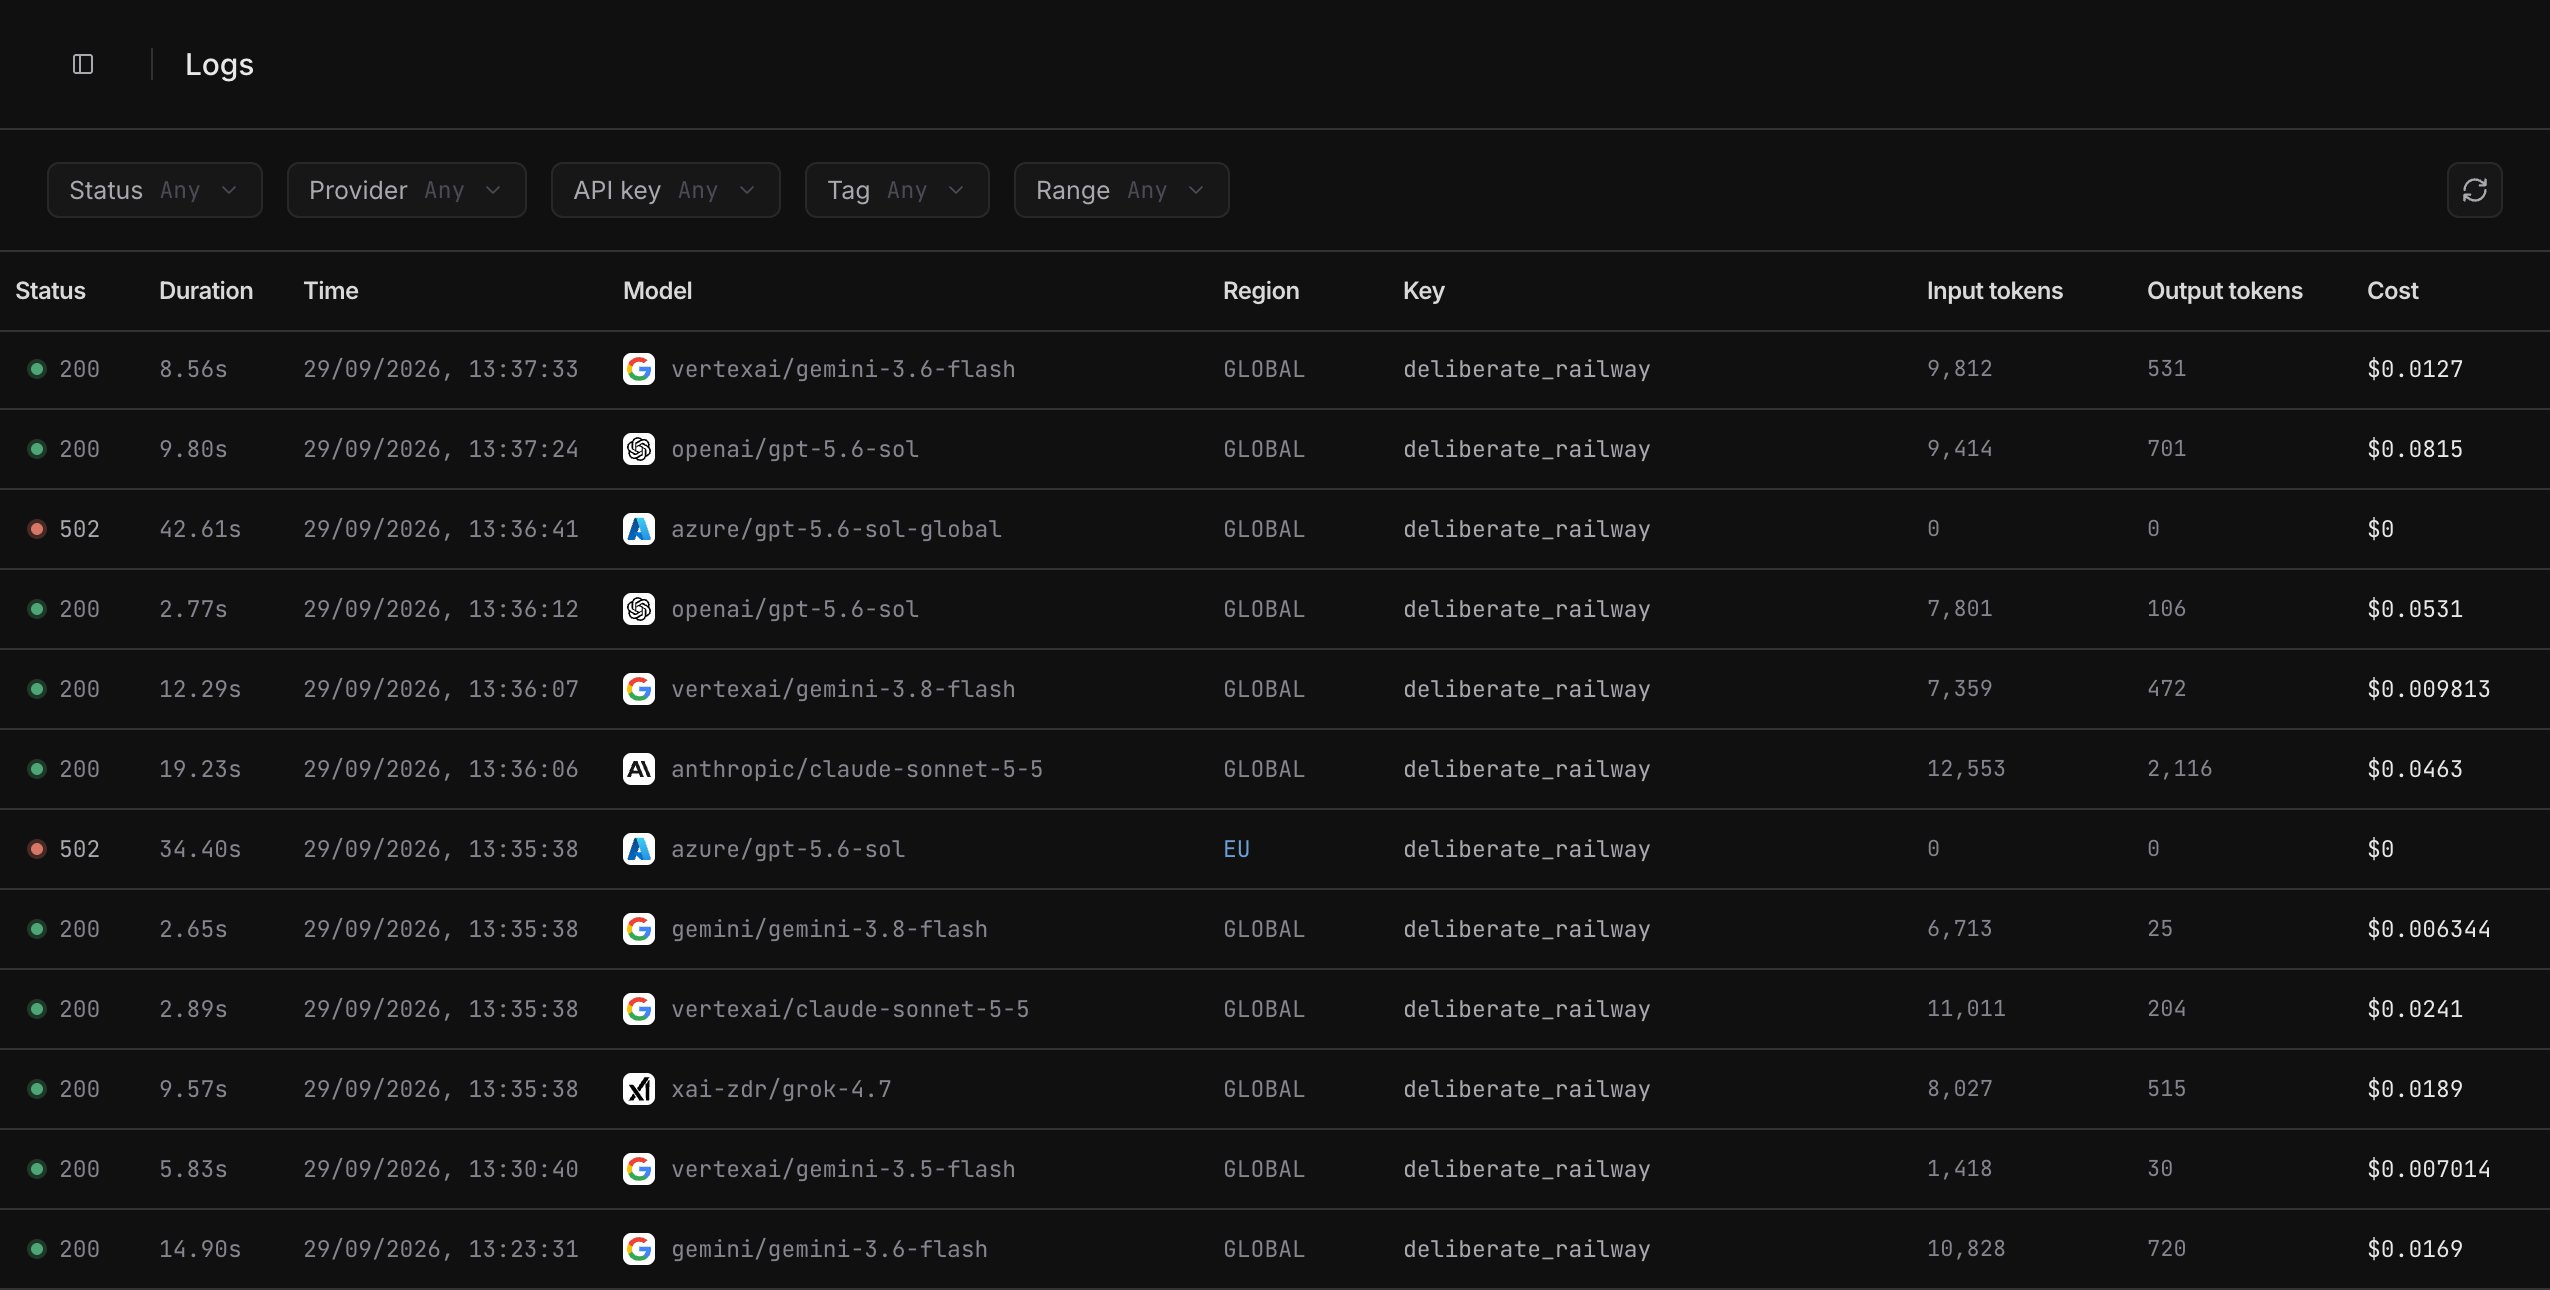
The log list
Each row is one provider call. When Opper retries a call or fails over to another provider, every attempt gets its own row, so one request can show up as several (see Routing).
Scroll down to load older calls. The list does not update by itself: select
the refresh button at the right of the filter bar to load new calls. With a
preset range such as Last hour, refresh also moves the range up to now.
Press
j and k or the arrow keys to move through the list, Enter to open
a log, and Esc to close it.
Filter the list
Filters search the project’s whole history, or the whole range, not only
the rows already loaded. A combination that matches very few calls can run
out of time before it fills a page; the list then says These filters took
too long. Pick a shorter range, or change or clear a filter.
Filter by tag
The Tag menu groups tags by key, with each value listed under its key.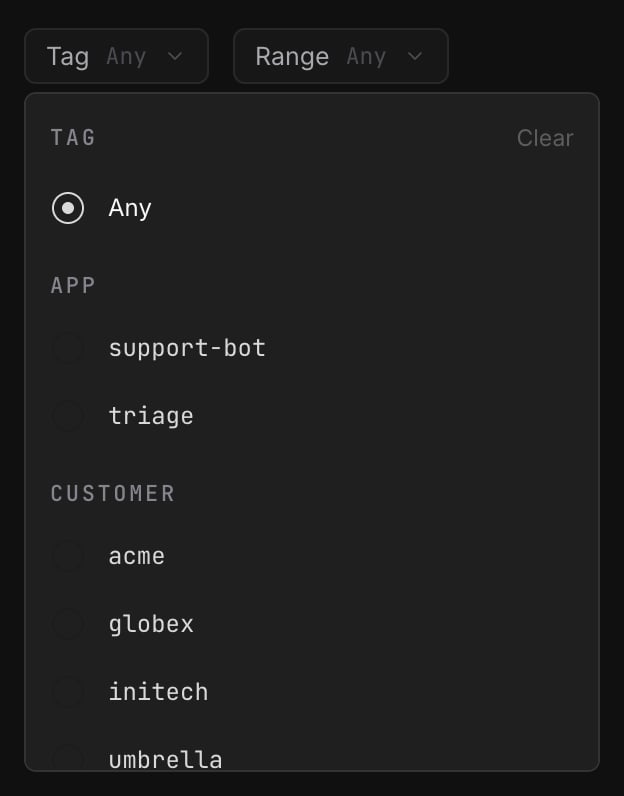
Log details
Select a row to open its details beside the list, or as a drawer on a narrow screen. The page URL carries the log’s ID (?log=gen_…), so you can share a
link that opens the same call.
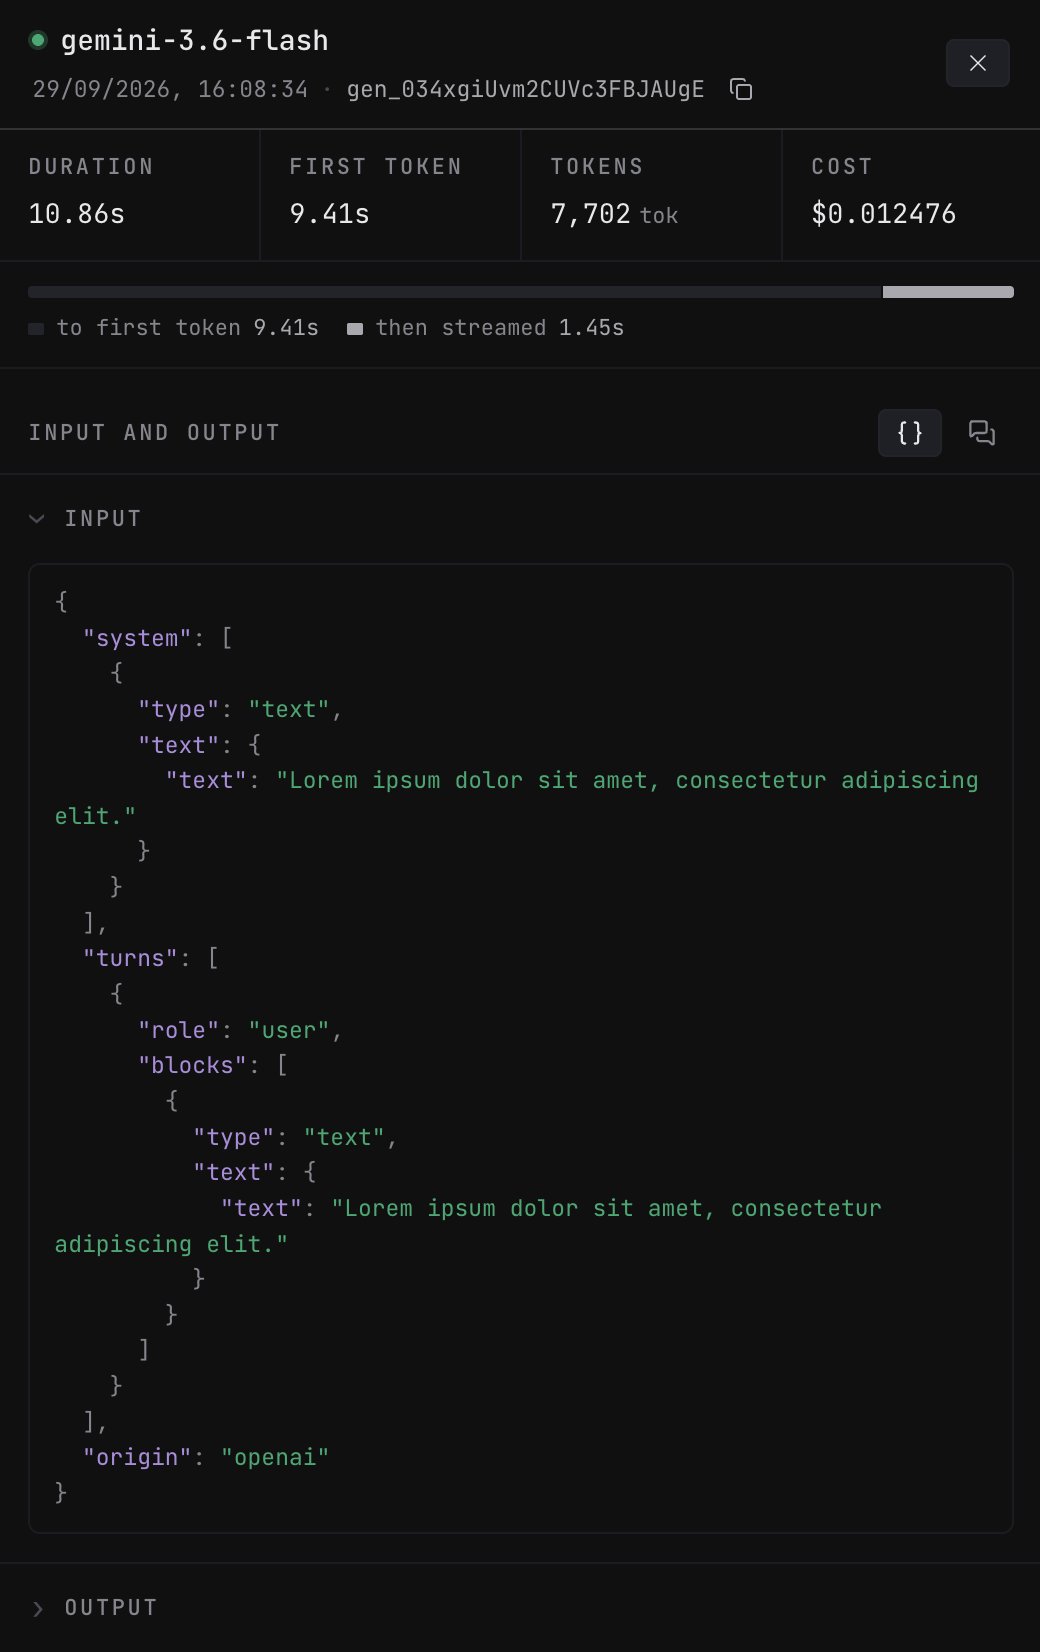
- The model, with a status dot, when the call ran, and the log ID. Use the copy button to copy the ID.
- Tags you sent with the call, as
key=value. Select one to filter the list by it; see Filter by tag. - Duration, First token, Tokens and Cost.
- For a streamed call, a bar that splits the duration at the first token: to first token, then then streamed for the rest of the response.
- Input and output, when they were stored. See Inputs, outputs and retention.
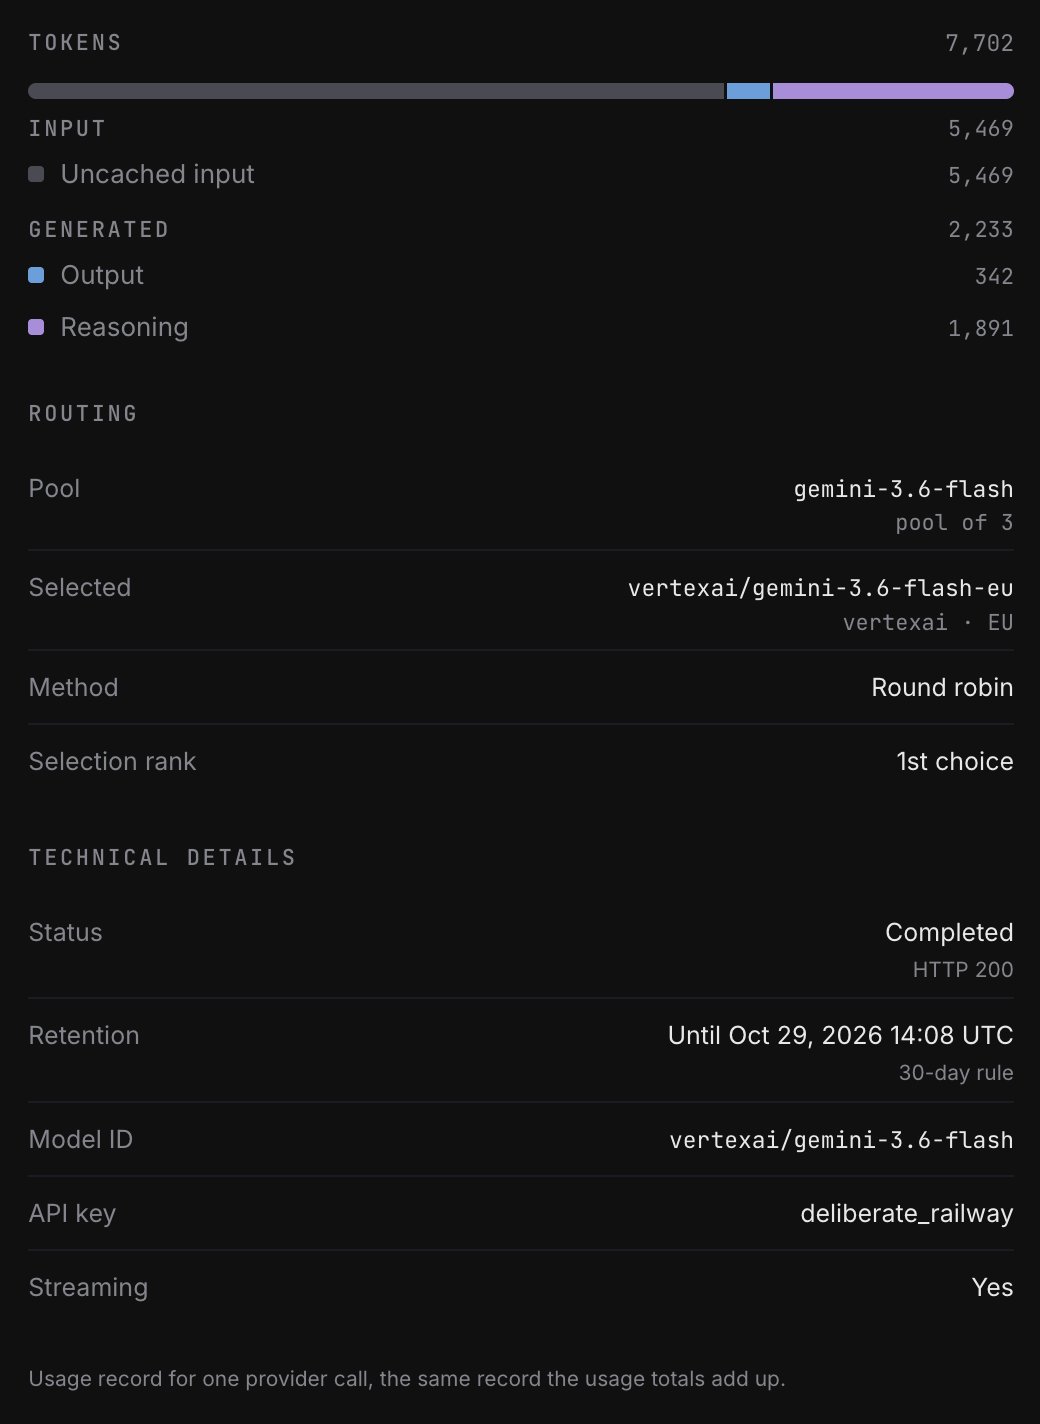
- Tokens: the total, and a bar that splits it into Input (cached reads, uncached input and cache writes) and Generated (output, and reasoning for reasoning models).
- Routing: which endpoint served the call, and why. See Routing.
- Technical details, below.
Status
The list shows each call’s HTTP status. The details spell out what it means, and the Status filter groups calls into three outcomes.
A blocked call never reached a provider, so it has no output. Its
Refusal row shows the refusal code.
Routing
When a call names a bare model, such asclaude-opus-5-5 rather than
aws/claude-opus-5-5, a model pool serves
it, and Routing explains how the pool placed the call:
Method is one of:
A call that fails over leaves a row for each attempt: the failed attempts
first, then the one that answered, with a Selection rank of 2nd choice or
later. A provider retried after a 429 or 5xx writes a second row at the same
rank.
A call that names a specific provider’s model, and a response served from
cache, show only Selected. So do calls made before Opper started recording
pool placement, so a missing Pool row does not mean the call was pinned.
Inputs, outputs and retention
Logs holds two kinds of data, kept for different lengths of time:- The usage record: everything in the list and the details except the input and output. Opper writes it for every call on every plan, including when retention is off, and keeps it for 5 years. It contains no prompts or responses.
- The input and output: stored only when a retention rule covers the call’s project, kept for that rule’s period of 1 to 30 days, then deleted.
Keep inputs and outputs with Control Plane
Retention rules are a Control Plane feature. On the Gateway plan, every call still appears in Logs with its full usage record, but its input and output are never stored. In their place, each log’s Input and output section explains what Control Plane keeps, with an Upgrade to Control Plane button.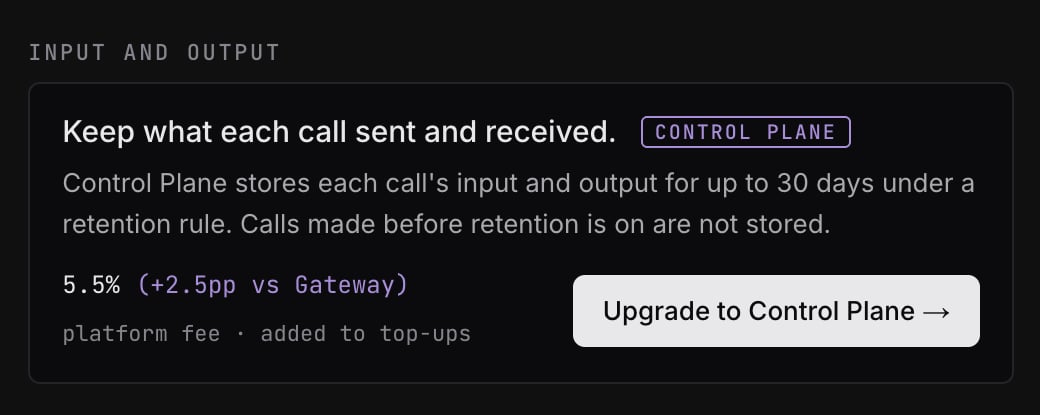
To see what your application actually sent and received, upgrade to
Control Plane, then turn on
Opper retention. Each new call’s input and
output then appear in Logs, and in Traces, for up to
30 days.
Retention counts from when the call was made
Whether a call’s input and output were stored is decided when the call runs, by the retention rule in effect then, and recorded on its log. Changing the rule later does not change what a call already has:- Turning retention on stores calls made after you save. Earlier calls stay Not stored.
- Turning retention off, shortening it, or moving to Gateway deletes nothing early. Stored inputs and outputs stay until the expiry they got when the call was made, and the Retention row adds off now for new calls.
What each log shows
How inputs and outputs are shown
- Messages render as a chat. Use the
{}toggle to see the raw JSON; a call with no chat shape always shows JSON. - A failed call shows its error text above the input.
- Images, audio and files sent inline are replaced with a placeholder; the media itself is not shown.
- An input or output over 1 MB is cut to its first 1 MB and marked Shortened.
- A blocked call has no output, since it never reached a provider.
Logs and traces
Logs and Traces answer different questions:
Use Logs to find a call by provider, key or outcome, and Traces to follow
everything a request did. Both read the same stored input and output, under
the same retention rule.
Where to go next
Opper retention
Turn on retention so new calls keep their input and output.
Traces
Follow a request through its model calls, tool calls and rules.
Tags & usage attribution
Tag calls so they are easy to find in Logs and to attribute in Usage.
Routing
Choose which provider a model pool tries first.